Matplotlib Linien zeichnen
Beim Zeichnen können wir den Linienstil anpassen, einschließlich Linientyp, Farbe und Größe usw.
Linientypen
Der Linientyp kann mit demlinestyle-Parameter festgelegt werden, abgekürzt alsls。
| Type | Kurzform | Beschreibung |
|---|---|---|
| 'solid' (Standard) | '-' | Durchgezogene Linie |
| 'dotted' | ':' | Gepunktete Linie |
| 'dashed' | '--' | Gestrichelte Linie |
| 'dashdot' | '-.' | Strich-Punkt-Linie |
| 'None' | '' oder ' ' | Keine Linie |
Beispiel
import numpy as np
ypoints = np.array([6, 2, 13, 10])
plt.plot(ypoints, linestyle = 'dotted')
plt.show()
Das Anzeigeergebnis ist wie folgt:

Mit der Kurzschreibweise:
Beispiel
import numpy as np
ypoints = np.array([6, 2, 13, 10])
plt.plot(ypoints, ls = '-.')
plt.show()
Das Anzeigeergebnis ist wie folgt:

Linienfarben
Die Linienfarbe kann mit demcolor-Parameter festgelegt werden, abgekürzt alsc。
Farbtypen:
| Farbcode | Beschreibung | |
|---|---|---|
| 'r' | Rot | |
| 'g' | Grün | |
| 'b' | Blau | |
| 'c' | Cyan | |
| 'm' | Magenta | |
| 'y' | Yellow | |
| 'k' | Schwarz | |
| 'w' | White | |
Natürlich können Sie auch Farbtypen anpassen, zum Beispiel:SeaGreen、#8FA6BCusw. Für die vollständigen Stile sieheHTML-Farbwerte。
Beispiel
import numpy as np
ypoints = np.array([6, 2, 13, 10])
plt.plot(ypoints, color = 'r')
plt.show()
Das Anzeigeergebnis ist wie folgt:

Beispiel
import numpy as np
ypoints = np.array([6, 2, 13, 10])
plt.plot(ypoints, c = '#8FA6BC')
plt.show()
Das Anzeigeergebnis ist wie folgt:

Beispiel
import numpy as np
ypoints = np.array([6, 2, 13, 10])
plt.plot(ypoints, c = 'SeaGreen')
plt.show()
Das Anzeigeergebnis ist wie folgt:

Linienbreite
Die Linienbreite kann mit dem linewidth -Parameter festgelegt werden, abgekürzt alslw, der Wert kann eine Gleitkommazahl sein, wie zum Beispiel:1、2.0、5.67usw.
Beispiel
import numpy as np
ypoints = np.array([6, 2, 13, 10])
plt.plot(ypoints, linewidth = '12.5')
plt.show()
Das Anzeigeergebnis ist wie folgt:

Mehrere Linien
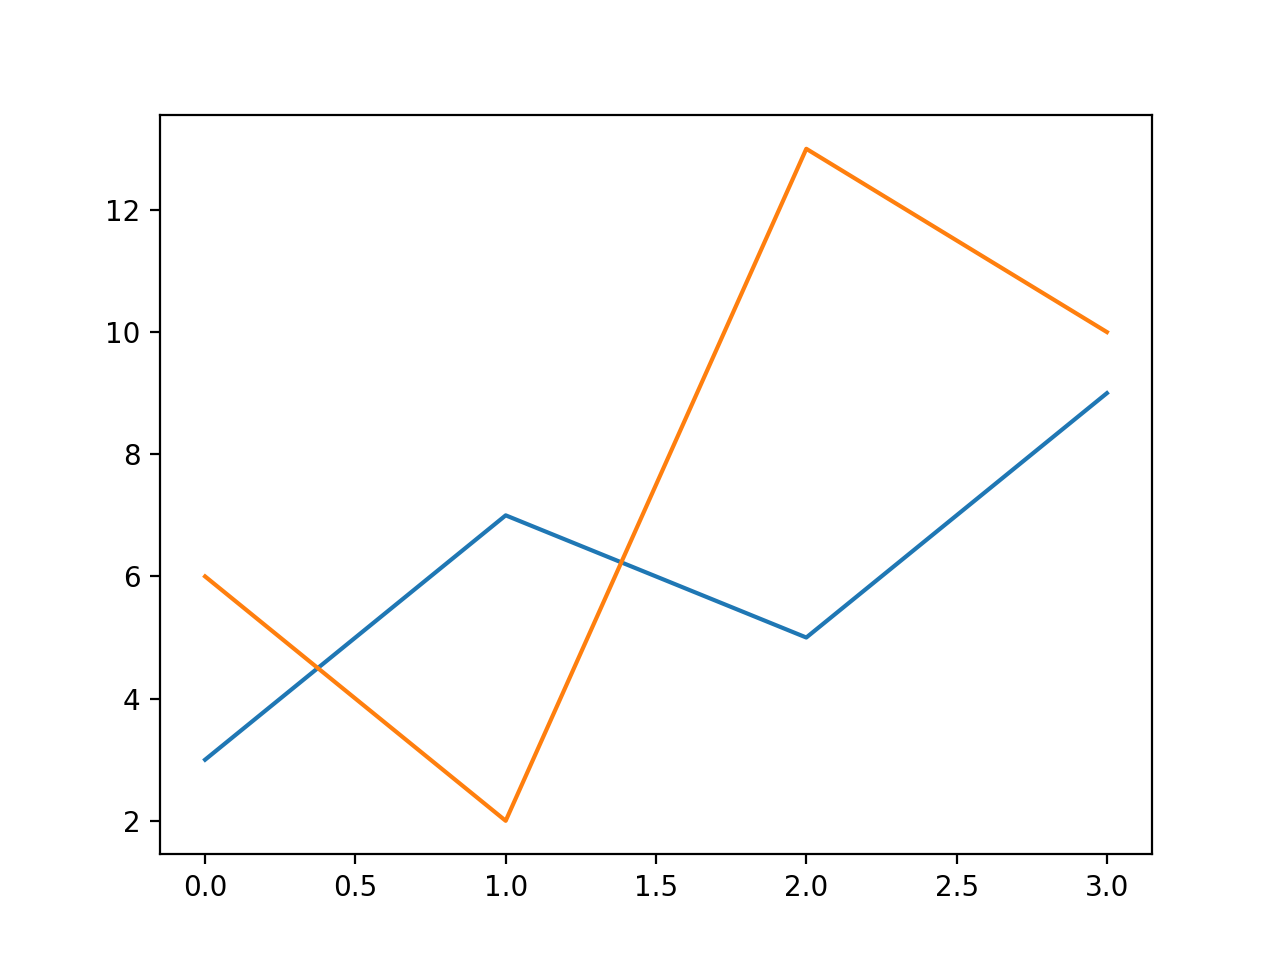
Die Methode plot() kann mehrere Paare von x-, y-Werten enthalten, um mehrere Linien zu zeichnen.
Beispiel
import numpy as np
y1 = np.array([3, 7, 5, 9])
y2 = np.array([6, 2, 13, 10])
plt.plot(y1)
plt.plot(y2)
plt.show()
Wie aus der obigen Abbildung ersichtlich ist,xwird der Wert standardmäßig auf gesetzt[0, 1, 2, 3]。
Das Anzeigeergebnis ist wie folgt:
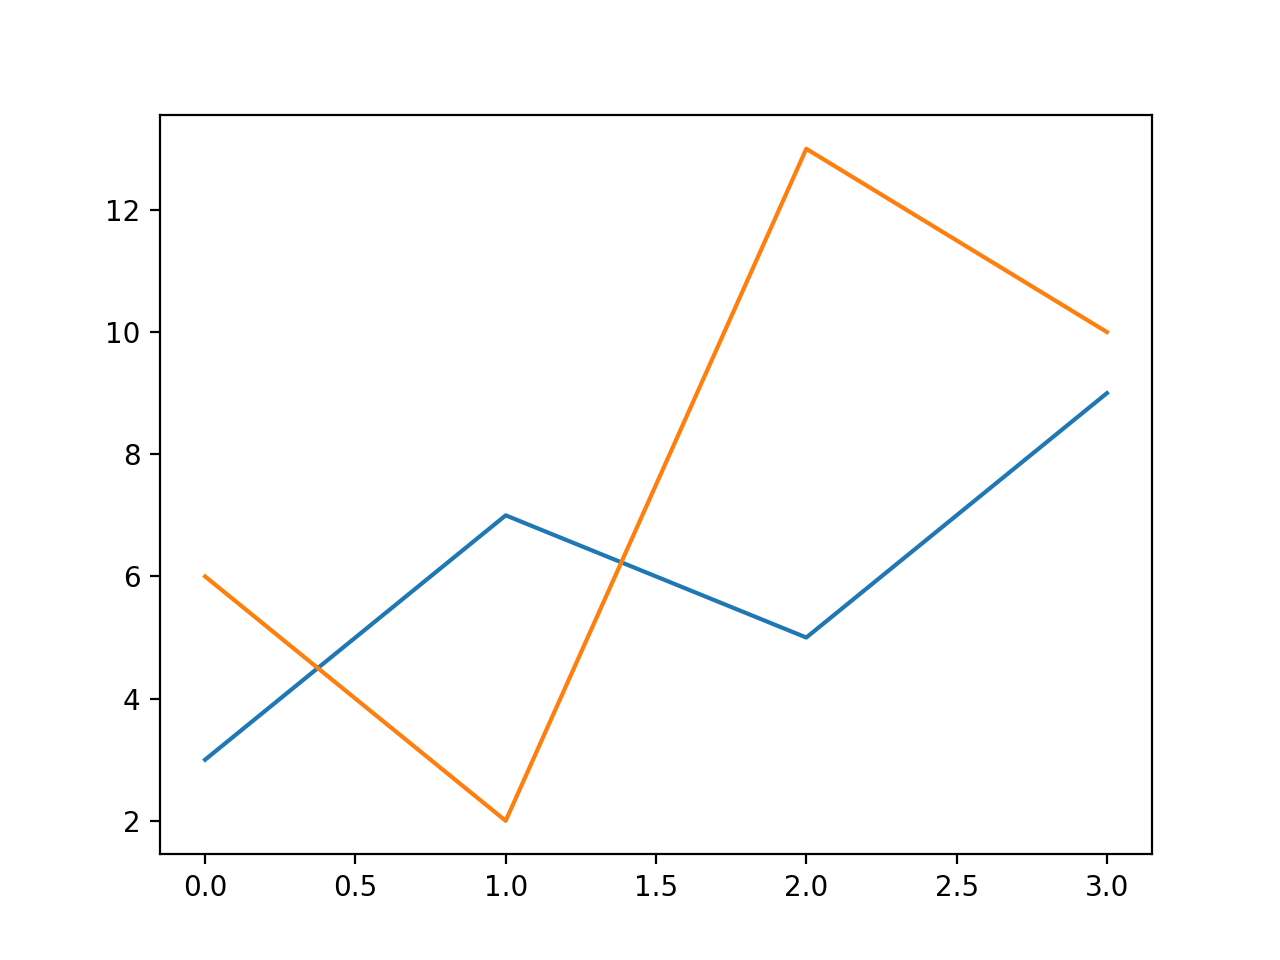
Wir können auch die x-Koordinatenwerte selbst festlegen:
Beispiel
import numpy as np
x1 = np.array([0, 1, 2, 3])
y1 = np.array([3, 7, 5, 9])
x2 = np.array([0, 1, 2, 3])
y2 = np.array([6, 2, 13, 10])
plt.plot(x1, y1, x2, y2)
plt.show()
Das Anzeigeergebnis ist wie folgt: