Matplotlib で複数のグラフを描画
私たちは pyplot 内のsubplot()とsubplots()メソッドを使用して複数のサブプロットを描画することができます。
subplot()メソッドは描画時に位置を指定する必要があり、subplots()メソッドは一度に複数生成でき、呼び出し時には生成されたオブジェクトの ax を呼び出すだけで済みます。
subplot
subplot(nrows, ncols, index, **kwargs)
subplot(pos, **kwargs)
subplot(**kwargs)
subplot(ax)
上記の関数は、描画領域全体を nrows 行と ncols 列に分割し、左から右、上から下の順に各サブ領域に番号を付けます。1...N、左上のサブ領域の番号は 1、右下の領域の番号は N であり、番号はパラメータindexによって設定できます。
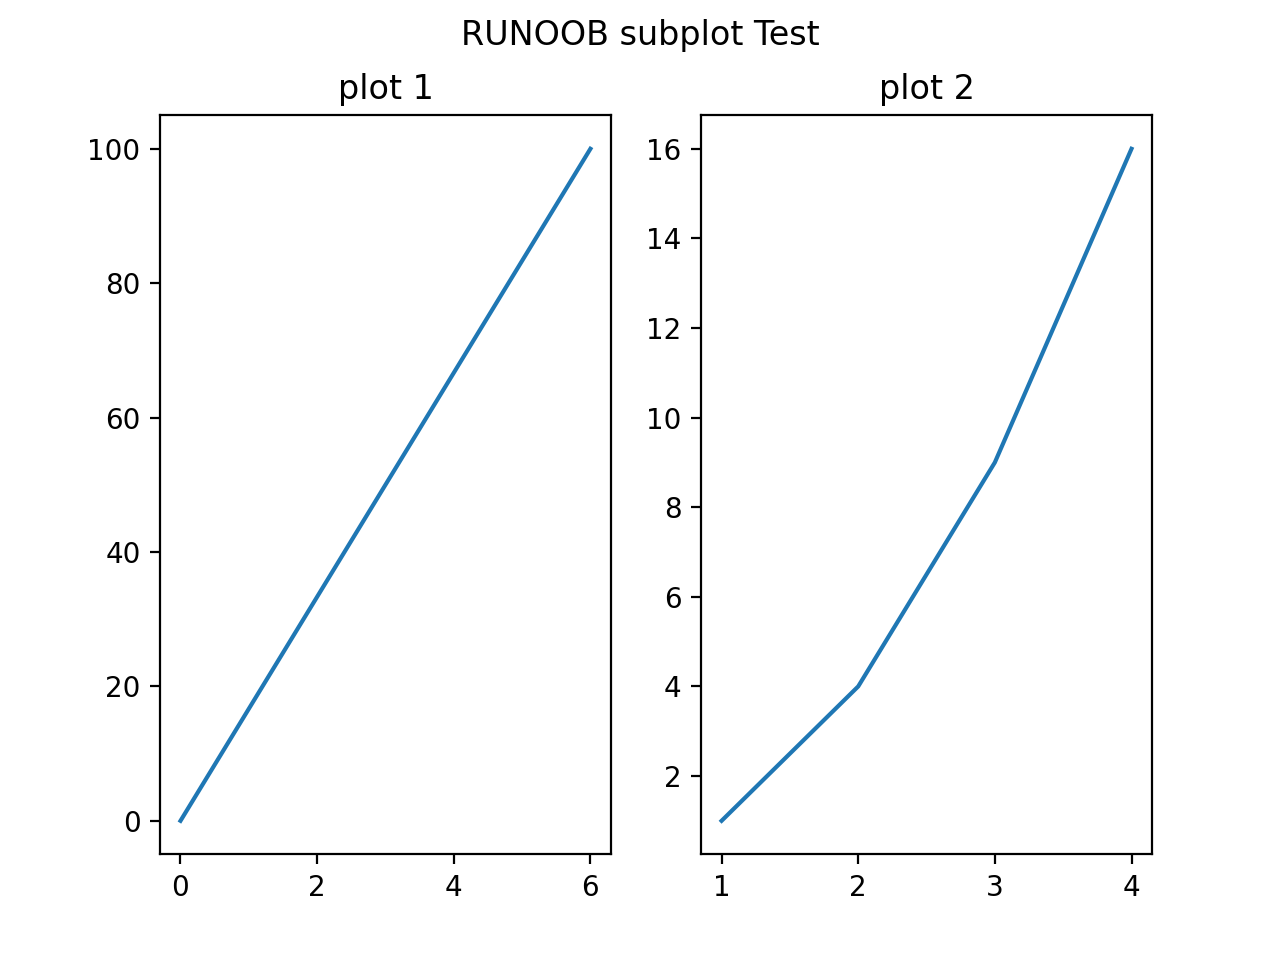
numRows = 1、numCols = 2 に設定すると、グラフは 1x2 の画像領域に描画され、対応する座標は次のとおりです:
(1, 1), (1, 2)
plotNum = 1、座標は (1, 1) を表し、つまり 1 行 1 列目のサブプロットです。
plotNum = 2、座標は (1, 2) を表し、つまり 1 行 2 列目のサブプロットです。
実例
import numpy as np
#plot 1:
xpoints = np.array([0, 6])
ypoints = np.array([0, 100])
plt.subplot(1, 2, 1)
plt.plot(xpoints,ypoints)
plt.title("plot 1")
#plot 2:
x = np.array([1, 2, 3, 4])
y = np.array([1, 4, 9, 16])
plt.subplot(1, 2, 2)
plt.plot(x,y)
plt.title("plot 2")
plt.suptitle("サンプル subplot Test")
plt.show()
表示結果は次のとおりです:
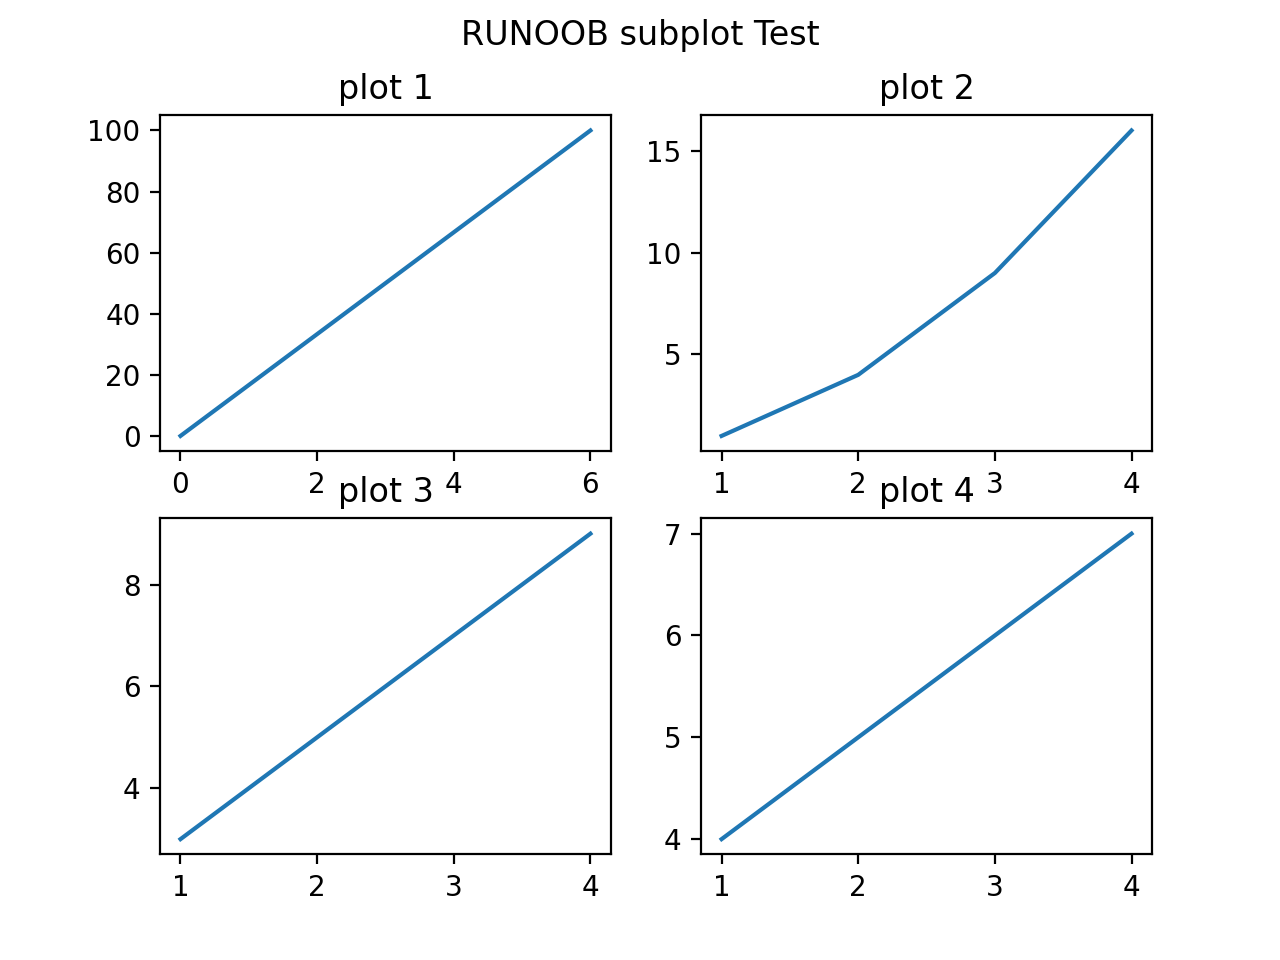
numRows = 2、numCols = 2 に設定すると、グラフは 2x2 の画像領域に描画され、対応する座標は次のとおりです:
(1, 1), (1, 2)
(2, 1), (2, 2)
plotNum = 1、座標は (1, 1) を表し、つまり 1 行 1 列目のサブプロットです。
plotNum = 2、座標は (1, 2) を表し、つまり 1 行 2 列目のサブプロットです。
plotNum = 3、座標は (2, 1) を表し、つまり 2 行 1 列目のサブプロットです。
plotNum = 4、座標は (2, 2) を表し、つまり 2 行 2 列目のサブプロットです。
実例
import numpy as np
#plot 1:
x = np.array([0, 6])
y = np.array([0, 100])
plt.subplot(2, 2, 1)
plt.plot(x,y)
plt.title("plot 1")
#plot 2:
x = np.array([1, 2, 3, 4])
y = np.array([1, 4, 9, 16])
plt.subplot(2, 2, 2)
plt.plot(x,y)
plt.title("plot 2")
#plot 3:
x = np.array([1, 2, 3, 4])
y = np.array([3, 5, 7, 9])
plt.subplot(2, 2, 3)
plt.plot(x,y)
plt.title("plot 3")
#plot 4:
x = np.array([1, 2, 3, 4])
y = np.array([4, 5, 6, 7])
plt.subplot(2, 2, 4)
plt.plot(x,y)
plt.title("plot 4")
plt.suptitle("サンプル subplot Test")
plt.show()
表示結果は次のとおりです:
subplots()
subplots() メソッドの構文は次のとおりです:
matplotlib.pyplot.subplots(nrows=1, ncols=1, *, sharex=False, sharey=False, squeeze=True, subplot_kw=None, gridspec_kw=None, **fig_kw)パラメータの説明:
- nrows:デフォルトは 1、グラフの行数を設定します。
- ncols:デフォルトは 1、グラフの列数を設定します。
- sharex、sharey:x 軸と y 軸を共有するかどうかを設定します。デフォルトは false で、'none'、'all'、'row'、'col' に設定できます。 False または none の場合、各サブプロットの x 軸または y 軸は独立しています。True または 'all' の場合、すべてのサブプロットが x 軸または y 軸を共有します。'row' は各サブプロット行が x 軸または y 軸を共有するように設定し、'col' は各サブプロット列が x 軸または y 軸を共有するように設定します。
- squeeze:ブール値。デフォルトは True で、返される Axes(軸)オブジェクトから余分な次元を除去することを示します。N*1 または 1*N のサブプロットの場合は 1 次元配列を返し、N*M(N>1 かつ M>1)の場合は 2 次元配列を返します。False に設定した場合、スクイーズ操作は行われず、最終的に 1x1 であっても、要素が Axes インスタンスである 2 次元配列を返します。
- subplot_kw:オプション、辞書型。辞書のキーワードを add_subplot() に渡して、各サブプロットを作成します。
- gridspec_kw:オプション、辞書型。辞書のキーワードを GridSpec コンストラクタに渡して、サブプロットをグリッド(grid)内に作成します。
- **fig_kw:詳細なキーワード引数を figure() 関数に渡します。
実例
import numpy as np
# テストデータを作成 -- 図1
x = np.linspace(0, 2*np.pi, 400)
y = np.sin(x**2)
# 図とサブプロットを作成 -- 図2
fig, ax = plt.subplots()
ax.plot(x, y)
ax.set_title('Simple plot')
# 2 つのサブプロットを作成 -- 図3
f, (ax1, ax2) = plt.subplots(1, 2, sharey=True)
ax1.plot(x, y)
ax1.set_title('Sharing Y axis')
ax2.scatter(x, y)
# 4 つのサブプロットを作成 -- 図4
fig, axs = plt.subplots(2, 2, subplot_kw=dict(projection="polar"))
axs[0, 0].plot(x, y)
axs[1, 1].scatter(x, y)
# x 軸を共有
plt.subplots(2, 2, sharex='col')
# y 軸を共有
plt.subplots(2, 2, sharey='row')
# x 軸と y 軸を共有
plt.subplots(2, 2, sharex='all', sharey='all')
# これも x 軸と y 軸を共有
plt.subplots(2, 2, sharex=True, sharey=True)
# 番号 10 の図を作成、既に存在する場合は削除
fig, ax = plt.subplots(num=10, clear=True)
plt.show()
一部のグラフの表示結果は次のとおりです:
図1
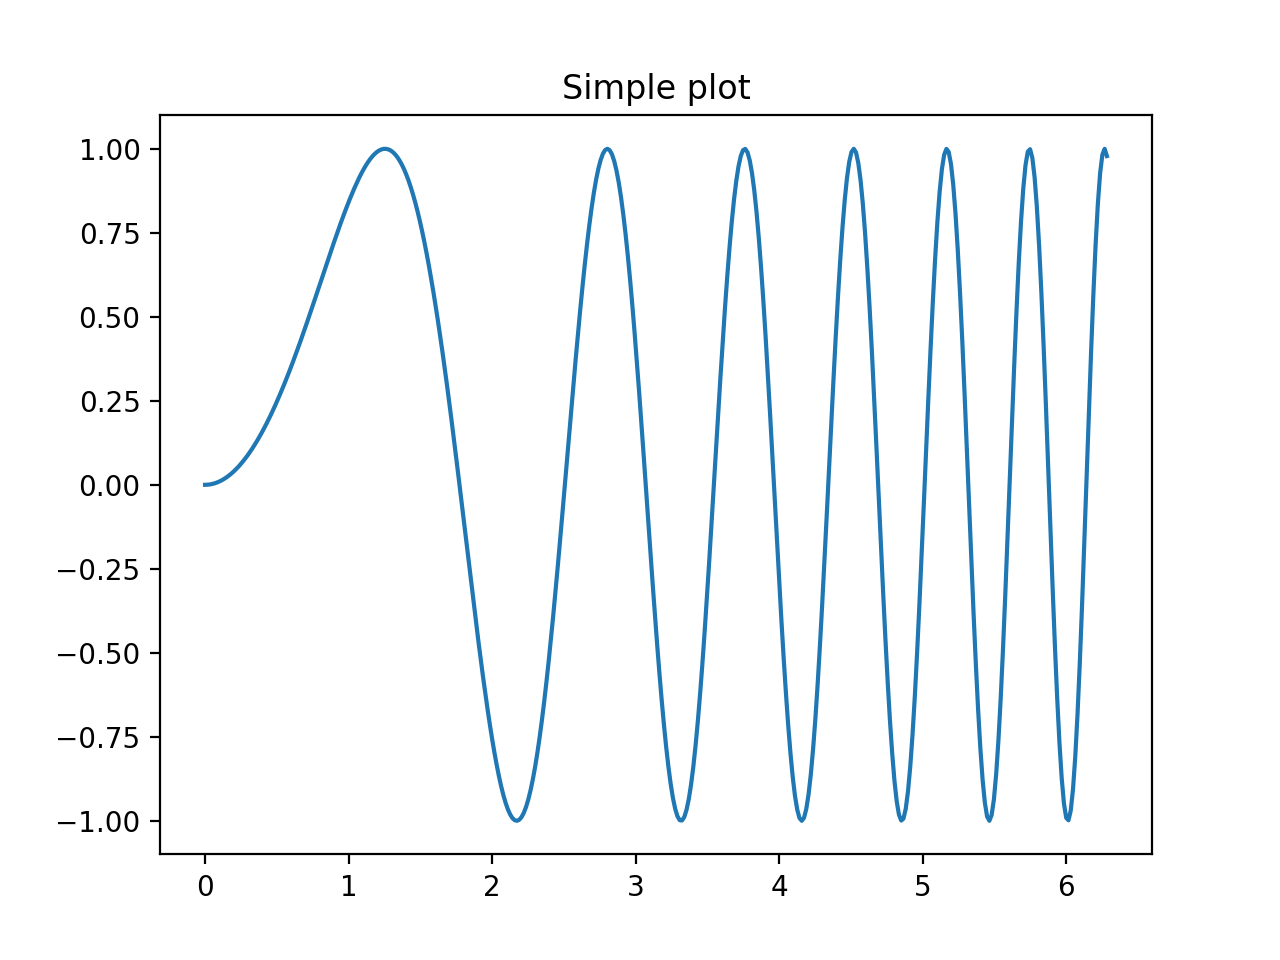
図2
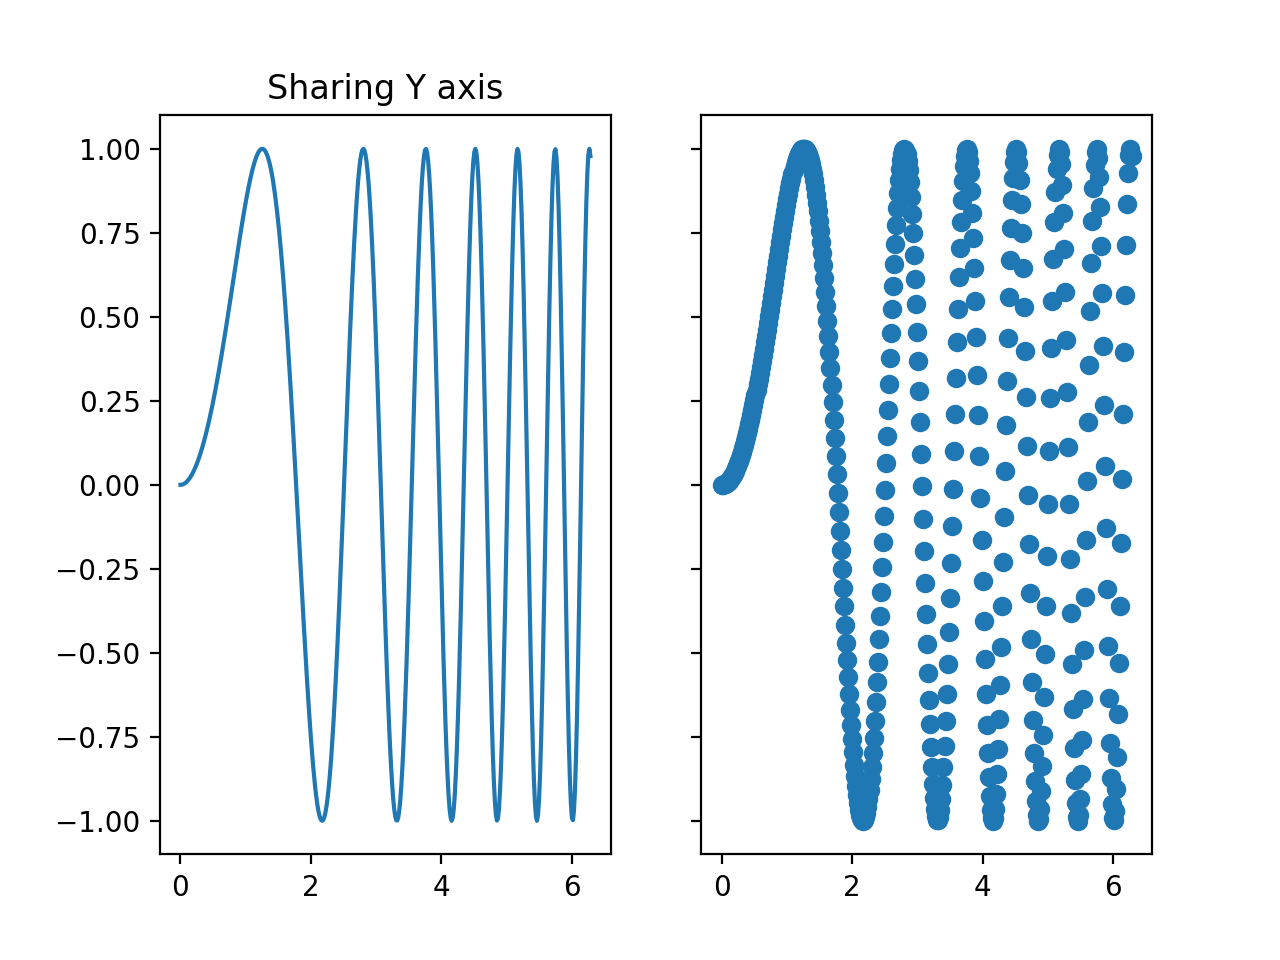
図3
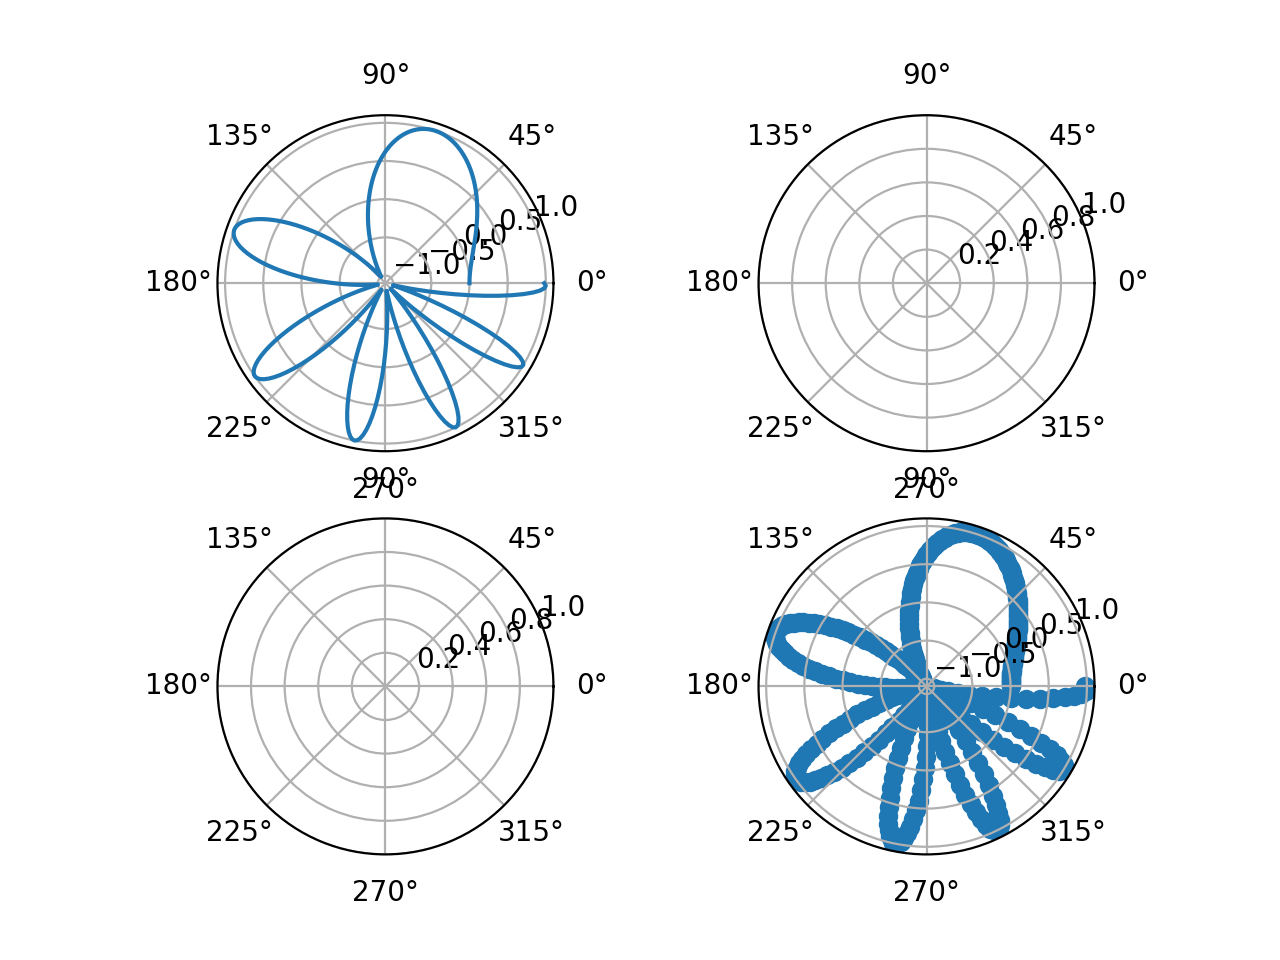
図4
