Matplotlib 棒グラフ
pyplot の bar() メソッドを使って棒グラフを描くことができます。
bar() メソッドの構文は次のとおりです:
matplotlib.pyplot.bar(x, height, width=0.8, bottom=None, *, align='center', data=None, **kwargs)
パラメータの説明:
x:浮動小数点型の配列。棒グラフの x 軸データ。
height:浮動小数点型の配列。棒グラフの高さ。
width:浮動小数点型の配列。棒グラフの幅。
bottom:浮動小数点型の配列。ベースの y 座標。デフォルトは 0。
align:棒グラフと x 座標の配置方法。'center' は x 位置を中心に配置します。これがデフォルト値です。 'edge':棒グラフの左端を x 位置に合わせます。右端を揃えるには、負の幅の値と align='edge' を渡します。
**kwargs::その他のパラメータ。
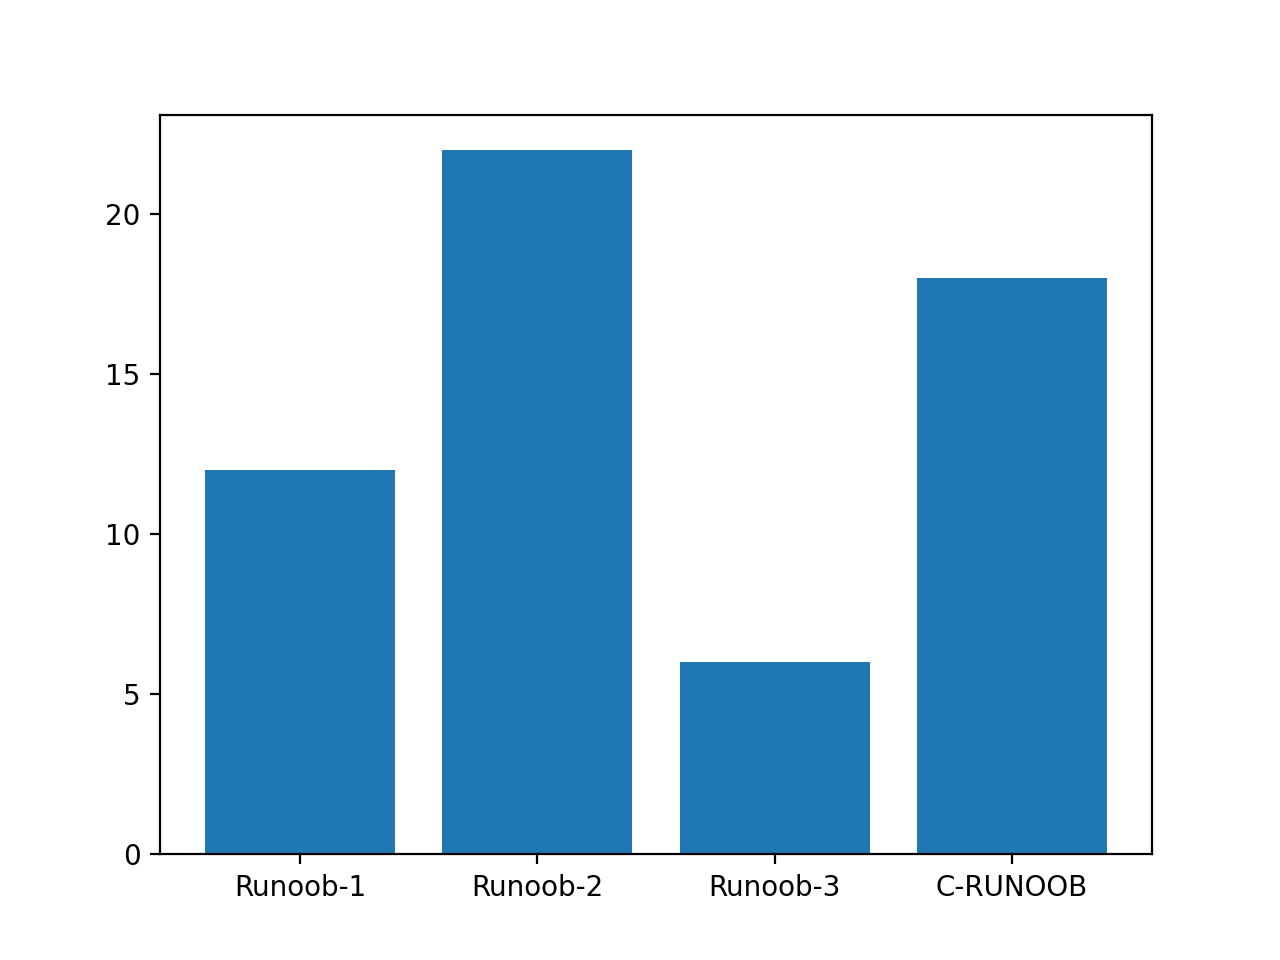
以下の例では、bar() を簡単に使用して棒グラフを作成します:
例
import matplotlib.pyplot as plt
import numpy as np
x = np.array(["サンプル-1", "サンプル-2", "サンプル-3", "C-サンプル"])
y = np.array([12, 22, 6, 18])
plt.bar(x,y)
plt.show()
import numpy as np
x = np.array(["サンプル-1", "サンプル-2", "サンプル-3", "C-サンプル"])
y = np.array([12, 22, 6, 18])
plt.bar(x,y)
plt.show()
表示結果は次のとおりです:
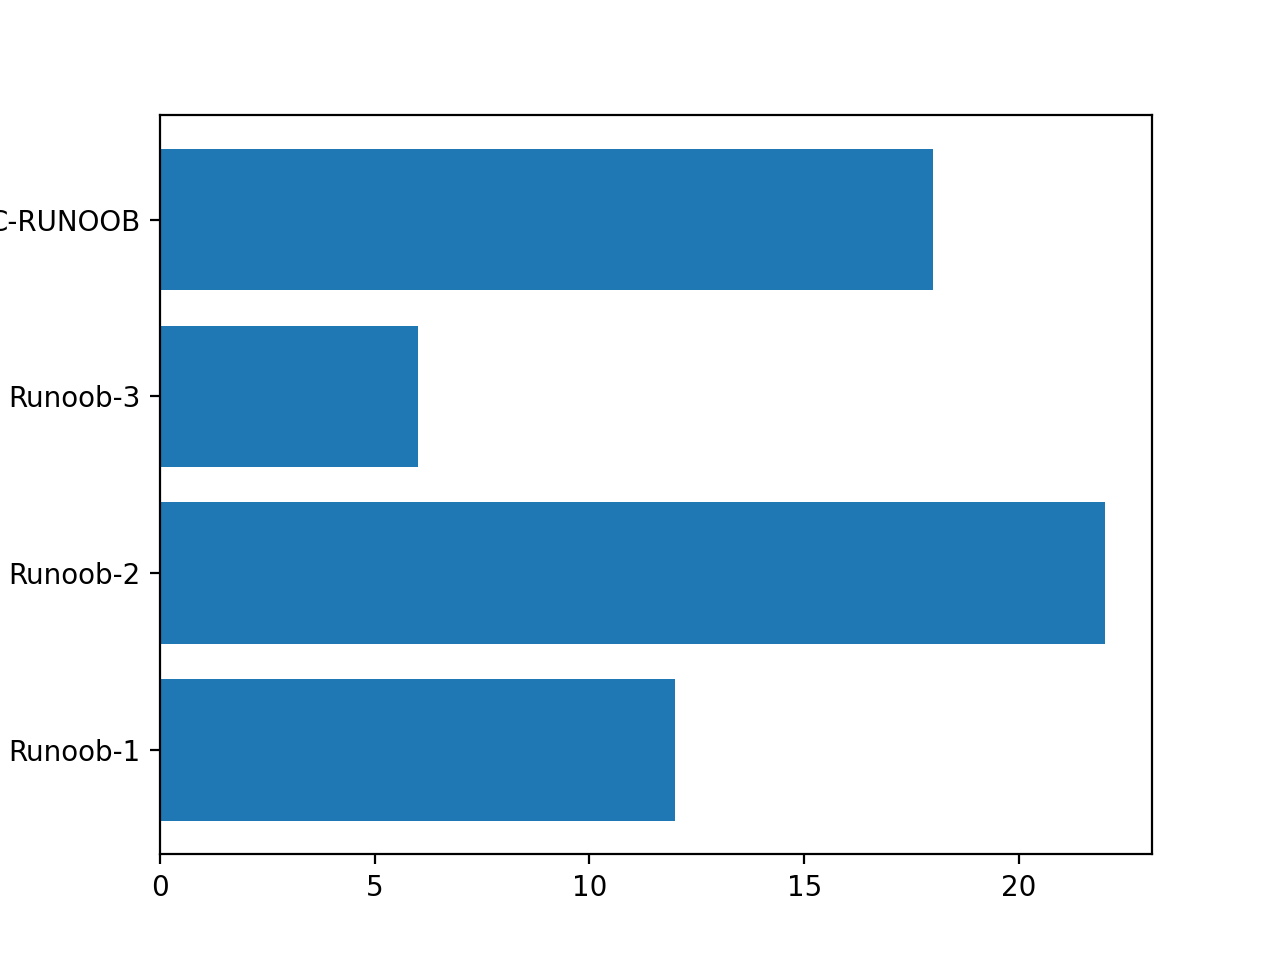
垂直方向の棒グラフは、barh()メソッドを使用して設定できます:
例
import matplotlib.pyplot as plt
import numpy as np
x = np.array(["サンプル-1", "サンプル-2", "サンプル-3", "C-サンプル"])
y = np.array([12, 22, 6, 18])
plt.barh(x,y)
plt.show()
import numpy as np
x = np.array(["サンプル-1", "サンプル-2", "サンプル-3", "C-サンプル"])
y = np.array([12, 22, 6, 18])
plt.barh(x,y)
plt.show()
表示結果は次のとおりです:
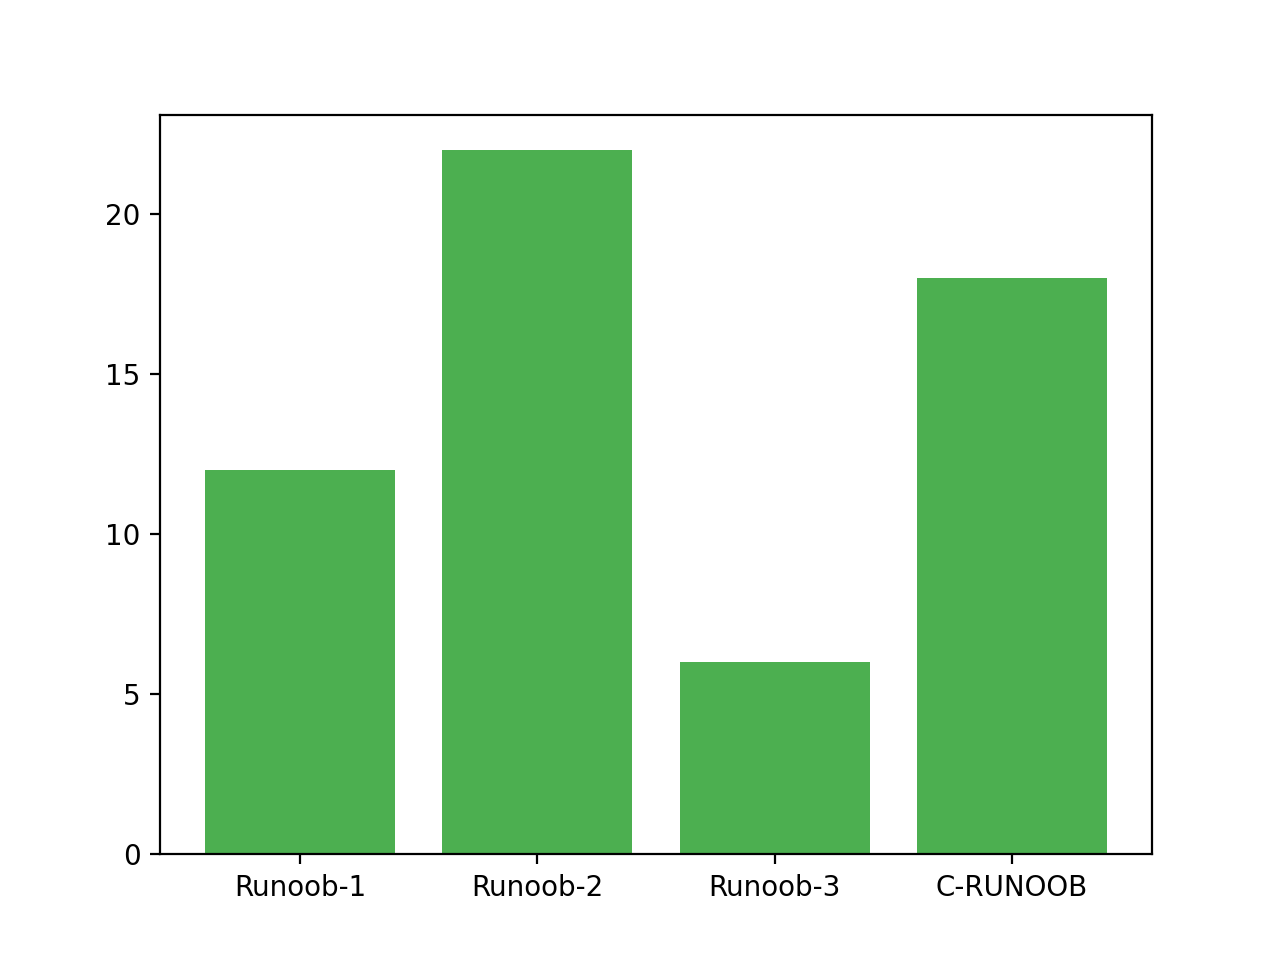
棒グラフの色を設定:
例
import matplotlib.pyplot as plt
import numpy as np
x = np.array(["サンプル-1", "サンプル-2", "サンプル-3", "C-サンプル"])
y = np.array([12, 22, 6, 18])
plt.bar(x, y, color = "#4C7EAF")
plt.show()
import numpy as np
x = np.array(["サンプル-1", "サンプル-2", "サンプル-3", "C-サンプル"])
y = np.array([12, 22, 6, 18])
plt.bar(x, y, color = "#4C7EAF")
plt.show()
表示結果は次のとおりです:
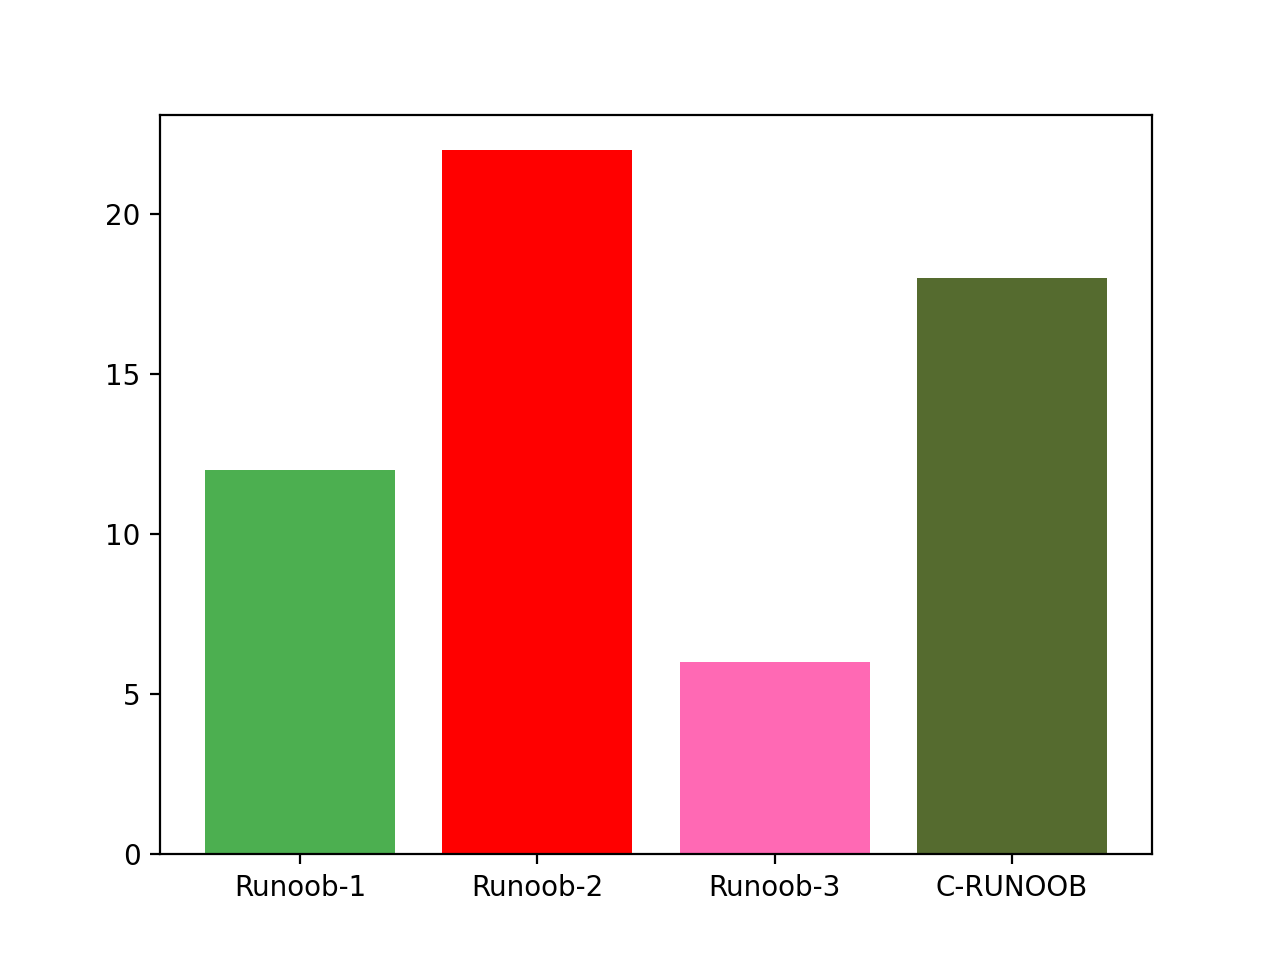
各棒の色をカスタマイズ:
例
import matplotlib.pyplot as plt
import numpy as np
x = np.array(["サンプル-1", "サンプル-2", "サンプル-3", "C-サンプル"])
y = np.array([12, 22, 6, 18])
plt.bar(x, y, color = ["#4C7EAF","red","hotpink","#4977A6"])
plt.show()
import numpy as np
x = np.array(["サンプル-1", "サンプル-2", "サンプル-3", "C-サンプル"])
y = np.array([12, 22, 6, 18])
plt.bar(x, y, color = ["#4C7EAF","red","hotpink","#4977A6"])
plt.show()
表示結果は次のとおりです:
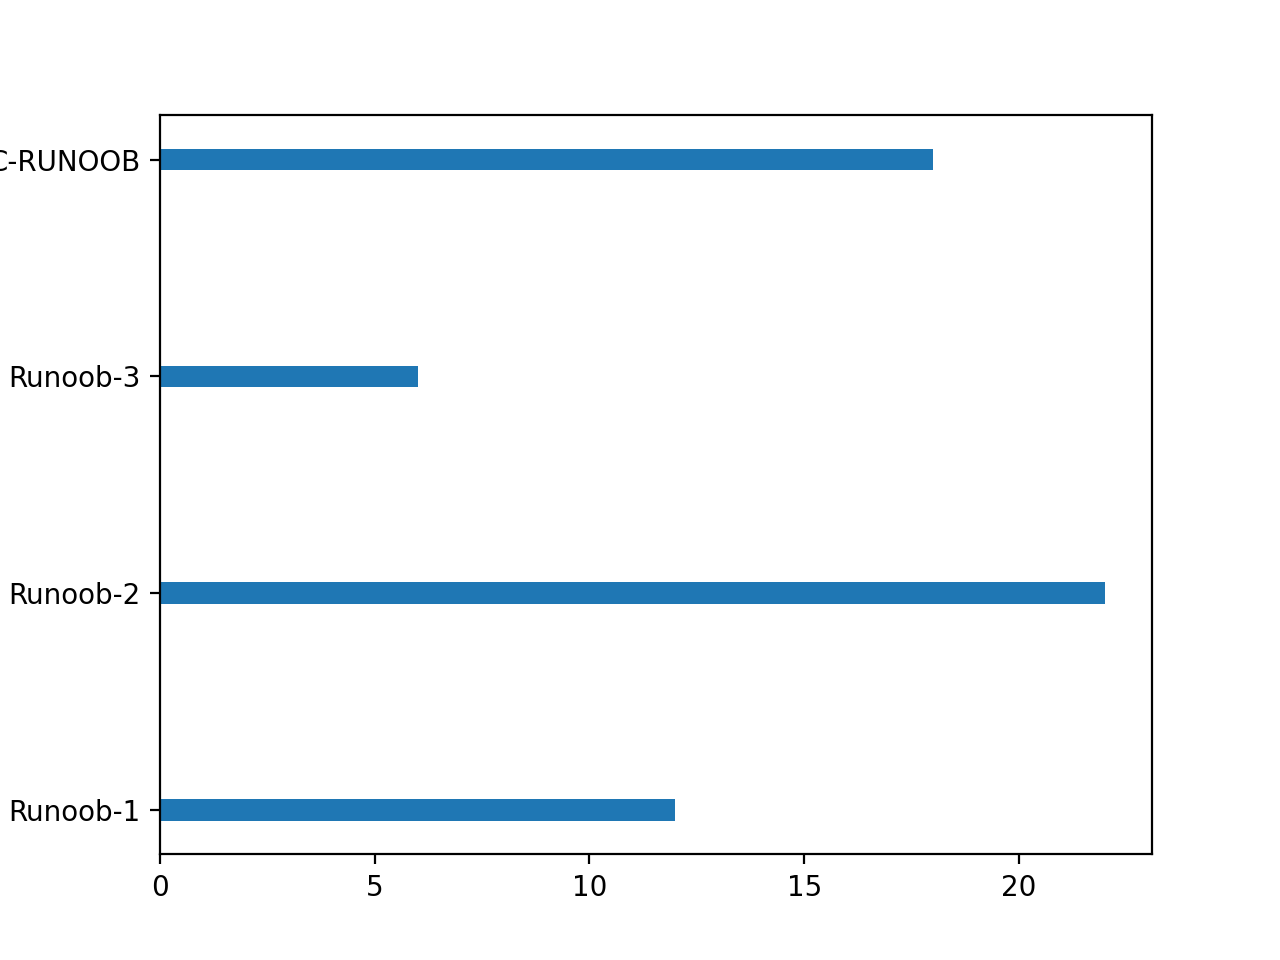
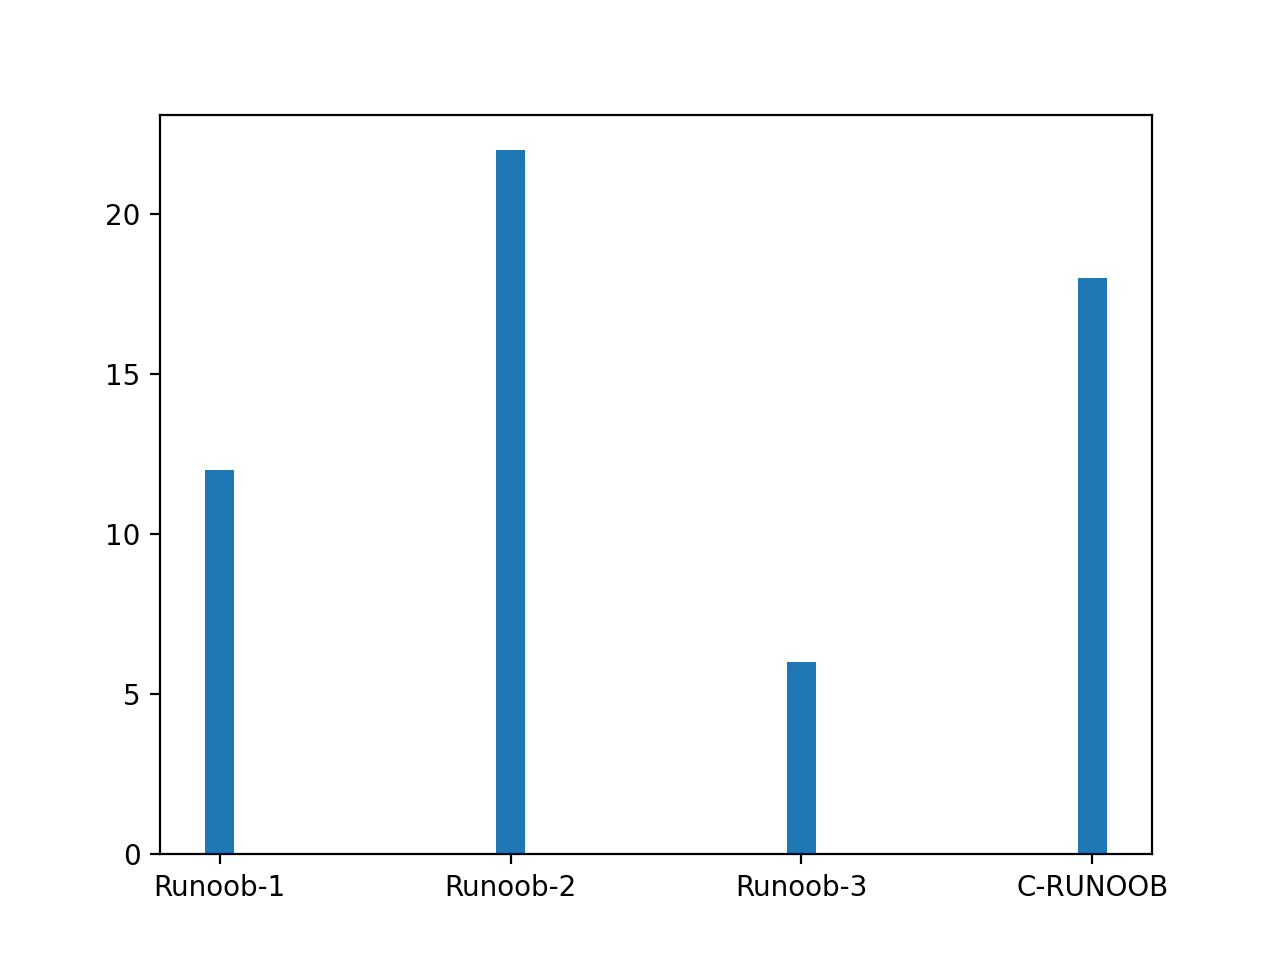
棒グラフの幅を設定し、bar()メソッドを使用してwidth設定し、barh()メソッドを使用してheightheight を設定します
例
import matplotlib.pyplot as plt
import numpy as np
x = np.array(["サンプル-1", "サンプル-2", "サンプル-3", "C-サンプル"])
y = np.array([12, 22, 6, 18])
plt.bar(x, y, width = 0.1)
plt.show()
import numpy as np
x = np.array(["サンプル-1", "サンプル-2", "サンプル-3", "C-サンプル"])
y = np.array([12, 22, 6, 18])
plt.bar(x, y, width = 0.1)
plt.show()
表示結果は次のとおりです:
例
import matplotlib.pyplot as plt
import numpy as np
x = np.array(["サンプル-1", "サンプル-2", "サンプル-3", "C-サンプル"])
y = np.array([12, 22, 6, 18])
plt.barh(x, y, height = 0.1)
plt.show()
import numpy as np
x = np.array(["サンプル-1", "サンプル-2", "サンプル-3", "C-サンプル"])
y = np.array([12, 22, 6, 18])
plt.barh(x, y, height = 0.1)
plt.show()
表示結果は次のとおりです: